

How many of you have heard this request: "Hi, there! How's it going? I know you're busy with that convening tomorrow, but can you send me any relevant data on the impact of our funding? I need it by the end of this week for a presentation...board meeting...foundation newsletter. Thanks!" You know the drill. Today's foundation program staff's job descriptions are expanding to include the ability to make grants that have a measurable impact. Inherent in that responsibility is your ability to collect and analyze outcome-related evidence: How do we know that our grants are having an
impact? How is our support helping (or not)? What have been the effects of our
grants—planned or unplanned? If these are your set of evaluation questions,
this thought has likely also crossed your mind: How do I make sense of all the
information from site visits, phone calls, conversations with the field, and
grant report documentation (videos, narratives, studies, articles)? I know that we're having an impact, because I hear, read, and see it, but when it comes to collecting it for a report, it's hard to know where to start!
Oftentimes, this material sits in a cabinet until an evaluation opportunity comes up when, more likely than not, the consultant asks you for all this material. Or, maybe you’re one of the lucky ones who actually has an evaluation expert on staff to manage all this information. Either way, an under-recognized software tool that foundations should consider using is data analysis software. This software should be considered just as essential as your grants management software. In this post, I’m going to describe how to get started with one data analysis software called Dedoose. I’m definitely not getting paid to promote them (they don't even know I exist), and this is really just an opportunity to share my positive experience with this product.
Oftentimes, this material sits in a cabinet until an evaluation opportunity comes up when, more likely than not, the consultant asks you for all this material. Or, maybe you’re one of the lucky ones who actually has an evaluation expert on staff to manage all this information. Either way, an under-recognized software tool that foundations should consider using is data analysis software. This software should be considered just as essential as your grants management software. In this post, I’m going to describe how to get started with one data analysis software called Dedoose. I’m definitely not getting paid to promote them (they don't even know I exist), and this is really just an opportunity to share my positive experience with this product.
To start, data analysis software is a tool that can be used
to analyze information that you have locked up in volumes of grants reports. These
software (and there are many competing products) are often used by researchers for
statistical data analysis in quantitative research and/or for qualitative
research to organize and identify patterns in text-, visual-, or oral-based
materials. Given that the primary users of data analysis software are
scientists, most are pretty technical, not very
user friendly, and not cheap. I’ve been using NVivo (for qualitative) and SPSS
(for quantitative), and they take a while to learn how to use, which is a reason
why such products don’t get picked up outside of academia or research work.
When I first encountered Dedoose, I was really impressed. I had a Eureka! moment when I first used it, because it was just so darn easy to use and holds so much promise for making all that grant report content (there's probably miles of it stacked in cabinets all across America) actually become relevant to outcome-focused work. What grantees don't realize is that their reports sit in cabinets not because of a lack of interest, but because it's 1) overwhelming to go back to them after an initial reading because there's just so many, and 2) it's difficult to transform the information into usable data without involving a lot of work. This is why program staff might have favorite writers to return to time and again when it's docket report-writing time or may keep a running document of good quotes that they update--both pretty spotty and clunky efforts.
I promised a colleague
that I would help set up the technological infrastructure of their
grantmaking program to operationalize their evaluation process. In other words,
I am helping them organize their grant reports and other material evidence of
grant impact so that they can pull up stories and documentation of their grant
effects easily. So, instead of writing a procedures document just for them, I’m
using this opportunity to share this with all of you.
Some notes about Dedoose and what I will and won’t cover.
Dedoose is web-based, which I love because it allows program staff to access
the materials from home or office or wherever and can be shared via the cloud
with co-workers. But, for those of you whose foundations haven’t yet tackled
what it means to place grant materials on the cloud, be sure to discuss that
policy-level question first before subscribing. (I will point out, however,
that much scientific data is sensitive in nature, such as for studies of
adolescent behavior, incarcerated study subjects, and the like. Dedoose was built to protect your data to the utmost, but check it out
for yourself.) As for what I will and won’t cover, Dedoose does a great job
providing instructions on how to use its software, so I will assume that you
will refer to their video presentations for instruction. What I will supplement
is how to apply Dedoose for grant-related materials. I have made up a narrative grant report as my example for how to use “descriptors” and “code,”
which can be applied to include video uploads (e.g., if your grantee CEO was
interviewed on CNN and you want to store and code it for evaluation-relevant
content). So here we go…
To start, let’s create the scenario. You are an
environmental program officer working on two portfolios—healthy rivers and alternative
fuels. In your healthy rivers portfolio, you have a cohort of grantees who are
all part of a 2010-2013 multi-year funding cycle of advocacy-based
organizations. In this portfolio, you just received an interim grant report
from the fictitious Happy Earth Network, which received a three-year grant of
$300,000. In it, they described what they accomplished in 2012 because of your funding. They are super excited about the many objectives they
met.
Now, dust off your foundation or program’s Theory of
Change. Huh, you say? Hopefully, if done well and relatively recently, it will
provide you with exactly the kind of information that you need to look for in
order to assess if your grantmaking is on track. You don’t have to have it but
it does help, especially because a Theory of Change should reflect the
expectations of key foundation stakeholders (i.e., your co-workers, boss, and
board). When you start analyzing your data, you want to make sure that what you
analyze is of relevance to others, not just you. Here’s what you need to pluck
out from your Theory of Change (or here’s what you can ponder in the absence of
one):
- What are the objectives of my program’s funding? In this case, let’s say your program’s objective is to restore native salmon runs by dismantling dams in rivers where the environmental and social costs exceed the economic benefits.
- What should I be looking for to know if objectives are being met? You should have several indicators, so let’s use three as examples of outputs, outcomes, and impact. Output: Using your grant, grantee hires a communications director to sway public opinion in favor of dam removal. Outcome: Dam is removed. Impact: Salmon populations achieve sustainable levels in dam-removed watershed.
- What indicators should I be looking for? Achieving more than output-level results is challenging, so you need to track the indicators of trends moving toward (or away from) hoped-for outcomes and impacts. Given the three levels of objectives listed, here are some examples of indicators: Output-level change indicator: Number of Happy Earth Network’s Facebook followers climbs to indicate public recognition; Outcome-level change indicator: Grantees report swaying politicians to their side; Impact-level change indicator: Scientifically commissioned report shows salmon runs are re-appearing.
So, back to Dedoose. The first thing you want to do is to think
about how your stakeholders will want to slice and dice the data based on organizational
or grantmaking categories. Dedoose calls these “descriptors.” Will you need to demonstrate how a particular grantmaking portfolio is doing? Is your foundation
starting to expand its grantmaking to include, for instance, minority-led organizations? Think
about what information you might want for foundation communications: Maybe this
year’s annual report will showcase grantmaking in rural communities. In other
words, anticipate how you want to categorize your grantees. These categorical
buckets will enable you to organize and call up the data based on grantees’
demographic, organizational information. For this example, let’s say that these
categories are: ID #(this should be the same identifying number you use in your
grants management and files), Grant Program (Environment), Grant Portfolio
(Healthy Rivers), Cohort (Healthy Rivers-Advocacy Building), Grant amount
($300,000), Budget Size ($2 million), Org Founded (1995), Organization Name
(Happy Earth Network), Minority-Led (yes—Happy Earth Network is led by a Latina), Location of Grantees’ Office (Montana).
Next, return to your Theory of Change and look at your
indicators. These are, according to Dedoose, going to be your “codes.” Now
coding is a big deal. It’s the most important reason why you would turn to data
analysis software in the first place. Making up precise, targeted, and relevant codes is what will
enable you to call up useful grant report content and transform a 15-page narrative report from Happy Earth Network into a powerful data source.
Being able to quickly pull up relevant data, which has been separated out from a
lot of stuff that you don’t need, will help you generate communications content,
write to-the-point docket reports that are enlivened with relevant grantee
quotes, and be ready to analyze the coded content to spot trends, gather
evidence of the trends, and analyze trends. In turn, all this will help you distribute more targeted,
responsive grants and discern if your grantmaking strategy needs to change in
order to better reach your objectives. When I’ve used codes to look for
problems in grantmaking approach, that docket report section pretty much writes
itself when I see the relevant data excerpted from grant reports on that topic.
I suggest starting with the following as broad categorical codes to start: (a) grant impact on organization and/or its staff, (b) the organization’s impact on the field, audiences/public, and/or influentials, (c) challenges that grantee is facing, (d) grantee suggestions for improving your foundation's grantmaking, (e) grantee's praise of your foundation/board/staff, (f) board/boss-specific information, (g) quotes that can be used for communications and docket reports, and (h) items to monitor. Code names should be concise, so just use "monitor" instead of "items to monitor."
The codes you select are also quite personal and should reflect the character, interests, and objectives of your foundation. Let's pretend that an interest in youth is consistently shared across all your foundation's grantmaking programs, so I've used the code "youth impact" for examples of impact on youth.
Keep in mind, codes should be meaningful enough that everyone in your foundation is applying the same codes consistently. (Note, Dedoose allows individual users to review their coded work so they can compare their coding work with others, which will help avoid inter-reliability issues.) Ultimately, you want just the right amount of codes to find the information you need--not too broad that they bring up meaningless data, not too fine that the information you want doesn't come up, and not too many that you're overwhelmed by codes.
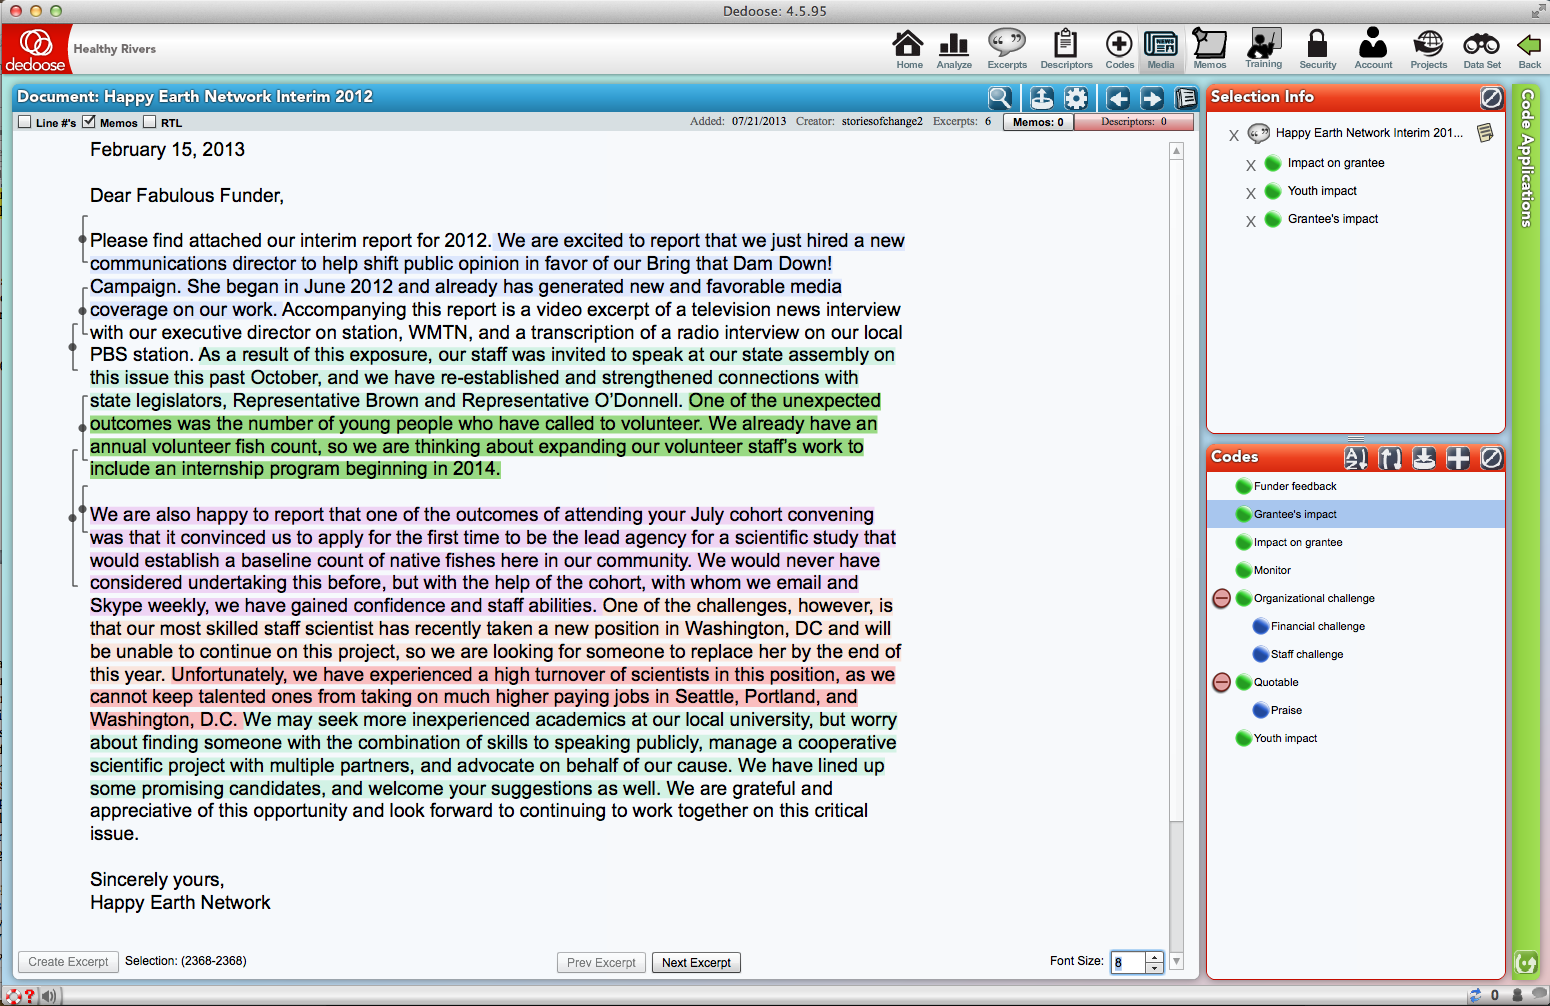
Here’s an example of coding Happy Earth Network’s
interim grant report. You can see the codes I made up in the bottom right box
labeled “Codes.” In the large field is the grant report. I thought that these two sentences, which I highlighted and then made into an "excerpt," indicate how Happy Earth Network used their grant, is affecting public perception, and is exciting youth attention to their cause. Hence, I assigned the following codes: "impact on grantee," "youth impact," and "grantee's impact." You can assign as many codes as you like to your selection. The idea is that every time you want to generate a report of all content that was assigned a code, such as "impact on grantee," only this content will be gathered and displayed together, with all other content filtered out.

Here's another example: I selected these sentences (highlighted in green), which are about Happy Earth Network's current organizational challenge (they have a hard time retaining scientists in their rural, low-paying community). At some point, when I want to review all the different kinds of challenges my grantees are facing, I can generate a report of just those selections coded "staff challenge" to analyze for any trends. I also coded this same selection "monitor" to remind me that I want to follow up on how Happy Earth Network is doing with hiring and retaining skilled staff.

And, here's what the document looks like when I'm done coding. Notice that some sentences don't get any coding at all, while others (as in the examples above) got one or more codes.
It looks quite messy, but you'll never need to look at this document in this state again. (If you want to read original grant reports, remember that your grants management system is the best place for managing and reviewing this kind of material. Data analysis instruments are just for analyzing the content.) Upon coding, you can forget about reading this grant report in this long narrative format. You, or your program associate, just read it in order to code it--now you just want to be able to call up the relevant bits. As an example, let's say you want to review only information that is relevant to how your grantmaking affected your grantees. Remember you have a code for this, so you can export all data coded "impact on grantee." Here's an example of how Dedoose exports this information (you can export it as an Excel or Word document--either one makes it easy for you to cut and paste for your report writing).

I've only coded one organization in this example, Happy Earth Network, but if we had other grantees' reports, their data would also come up under this code assignment. Keep in mind that you can upload and code not only grant reports, but also your site visit notes, transcripts of recordings, reviewers' notes, media coverage--anything that can be selected as text for you to assign codes. Also, remember your descriptors? You can apply a filter for only those types of organizational characteristics you want to examine. For instance, you can review the codes of only organizations in your grant portfolio (1st descriptor) that are in the current cohort (2nd descriptor).
You can use Dedoose as an individual program officer, or this tool
can be used throughout the foundation. There's healthy competition in the world of data analysis software, trying to make them easier and more powerful to use. A couple years ago, when I didn't know about Dedoose, I would never have suggested using data analysis tools for nonprofits, unless they were actually doing social science research and high-end evaluations. But, I stumbled on Dedoose for a project and found out first hand how they made this sophisticated program easy to use for any social change-oriented organization. What I love is that you can upload and code just about anything text or video based, it works on a Mac or PC, and it's remotely accessible as it is web- and not desktop-based. Dedoose will help you track, organize, and discern evidence of impact. So the next time you're asked for data about how your foundation's grantmaking is affecting your grantees or the field, you can say, "I can have it to you today!"


No comments:
Post a Comment